
When building a product that displays significant amounts of data to users in hundreds or thousands of records on lists and result pages, approaching that display without considering the detailed process of research users might take on those records may leave your product feeling feature light. Ultimately, it may fail at meeting expectations around what they can interact with, discern and feel comfortable knowing when it comes to looking at that data.
As part of our Building Better Products series, we wanted to highlight some of the key considerations we make when thinking about what needs to be present when including data tables within a product. These are not all of the important components to making successful data tables, but they are a few to keep in mind that often slip under the radar.
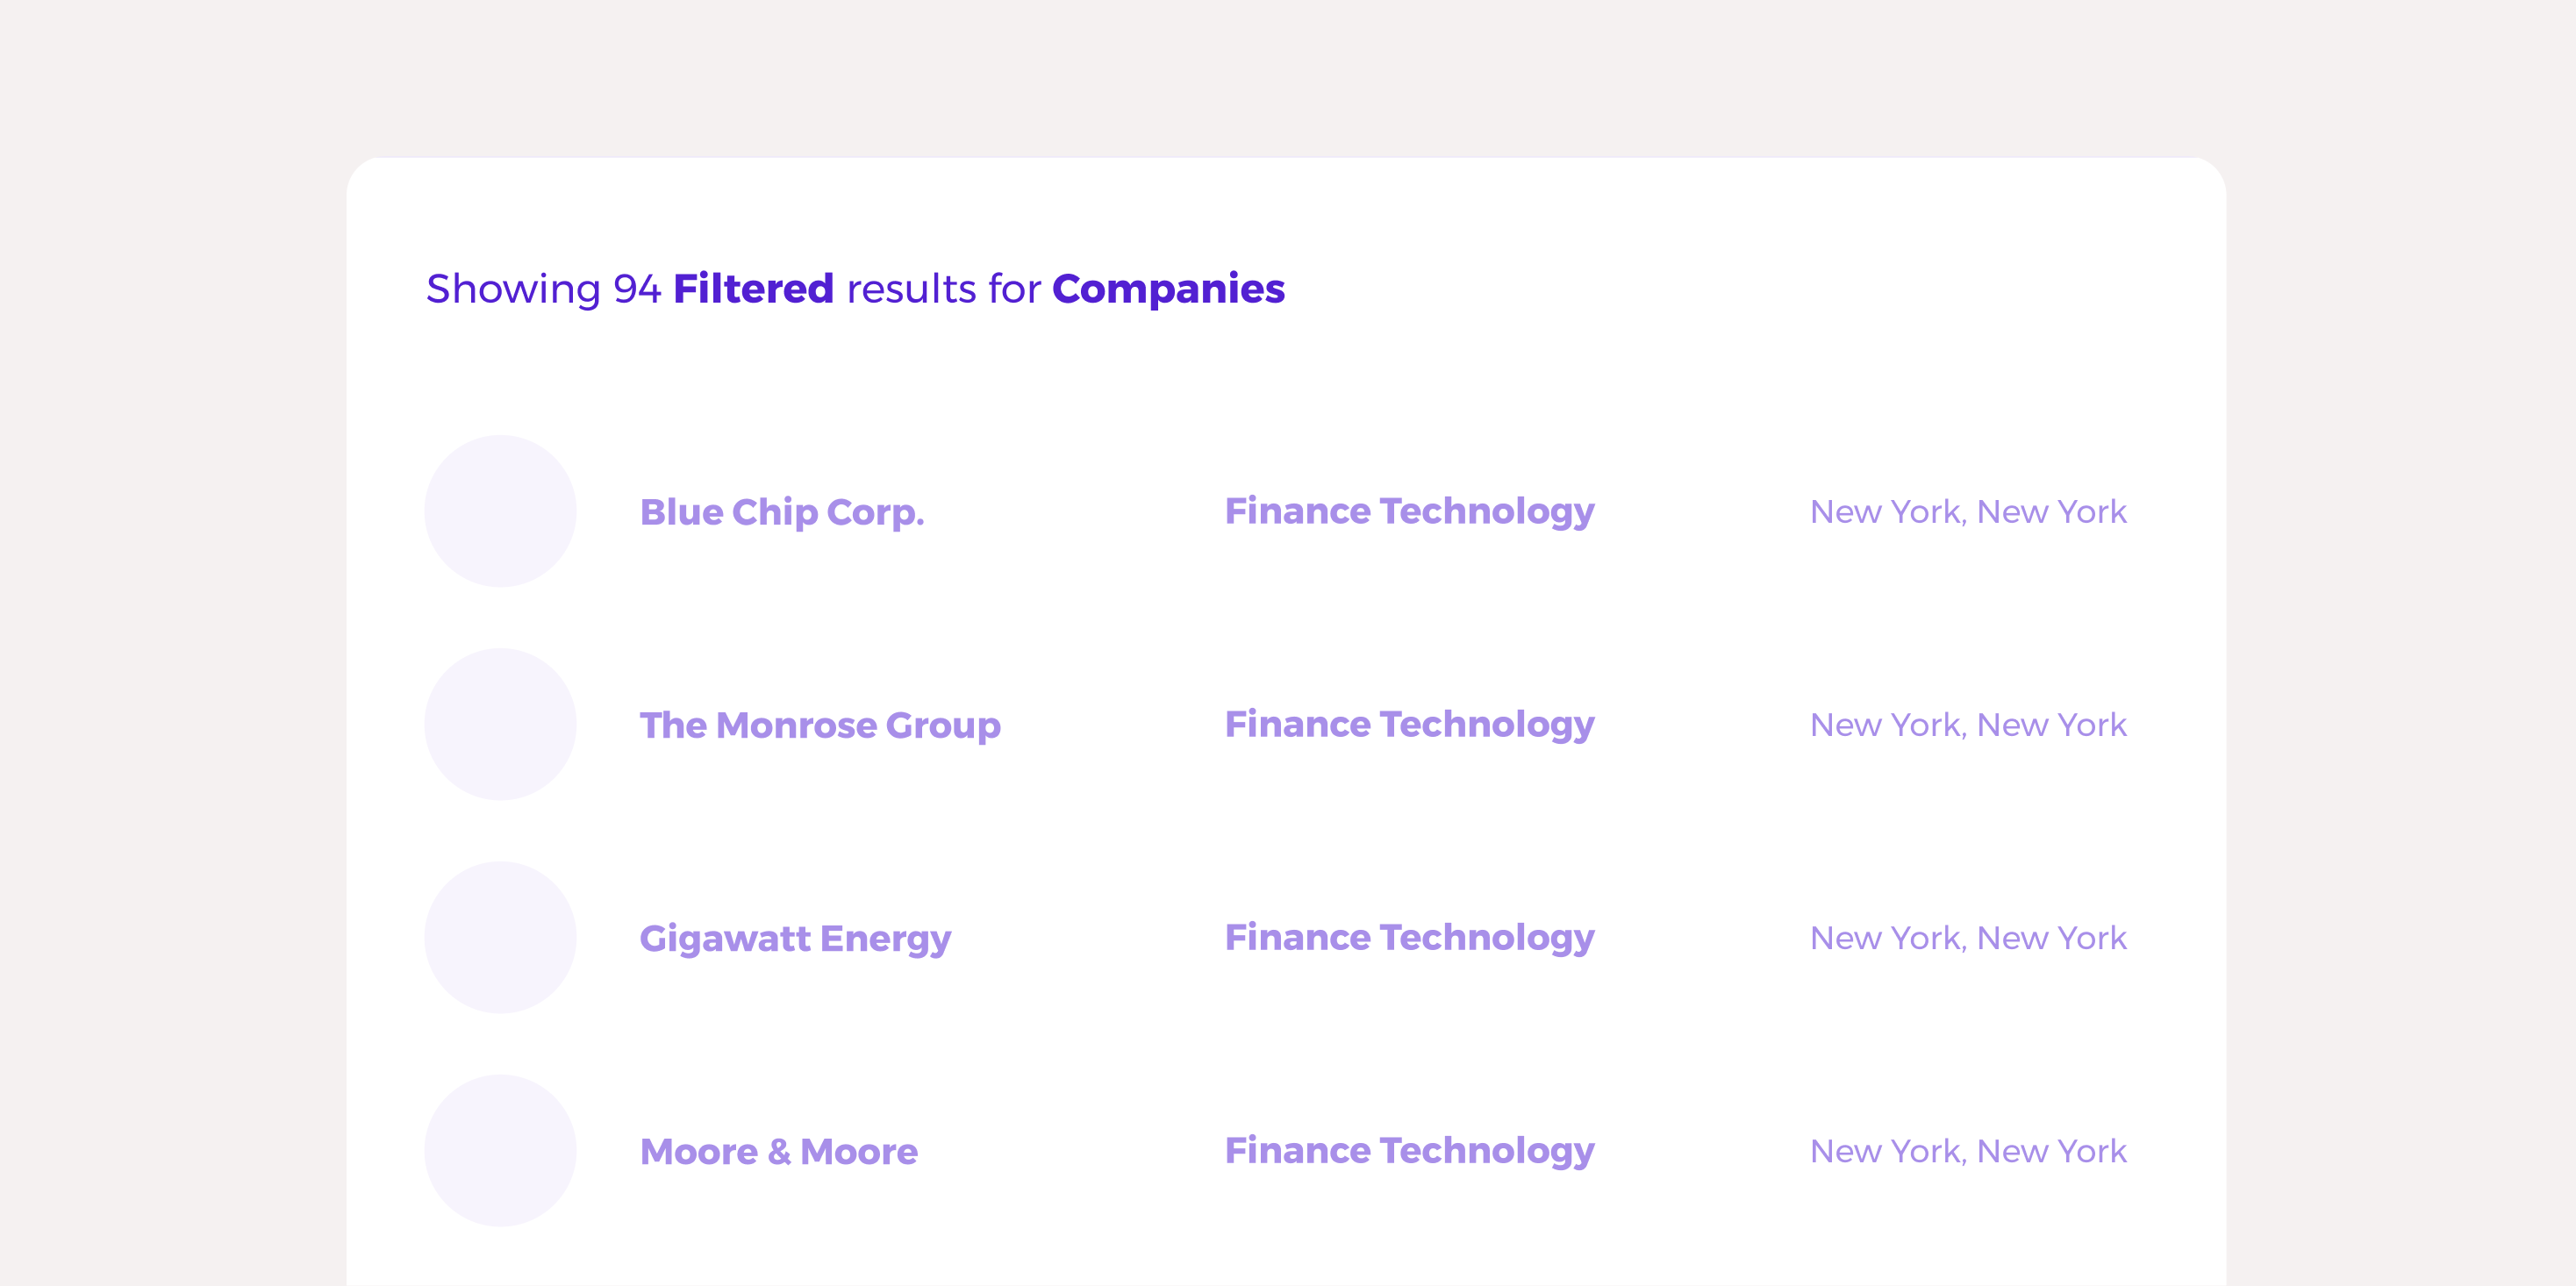
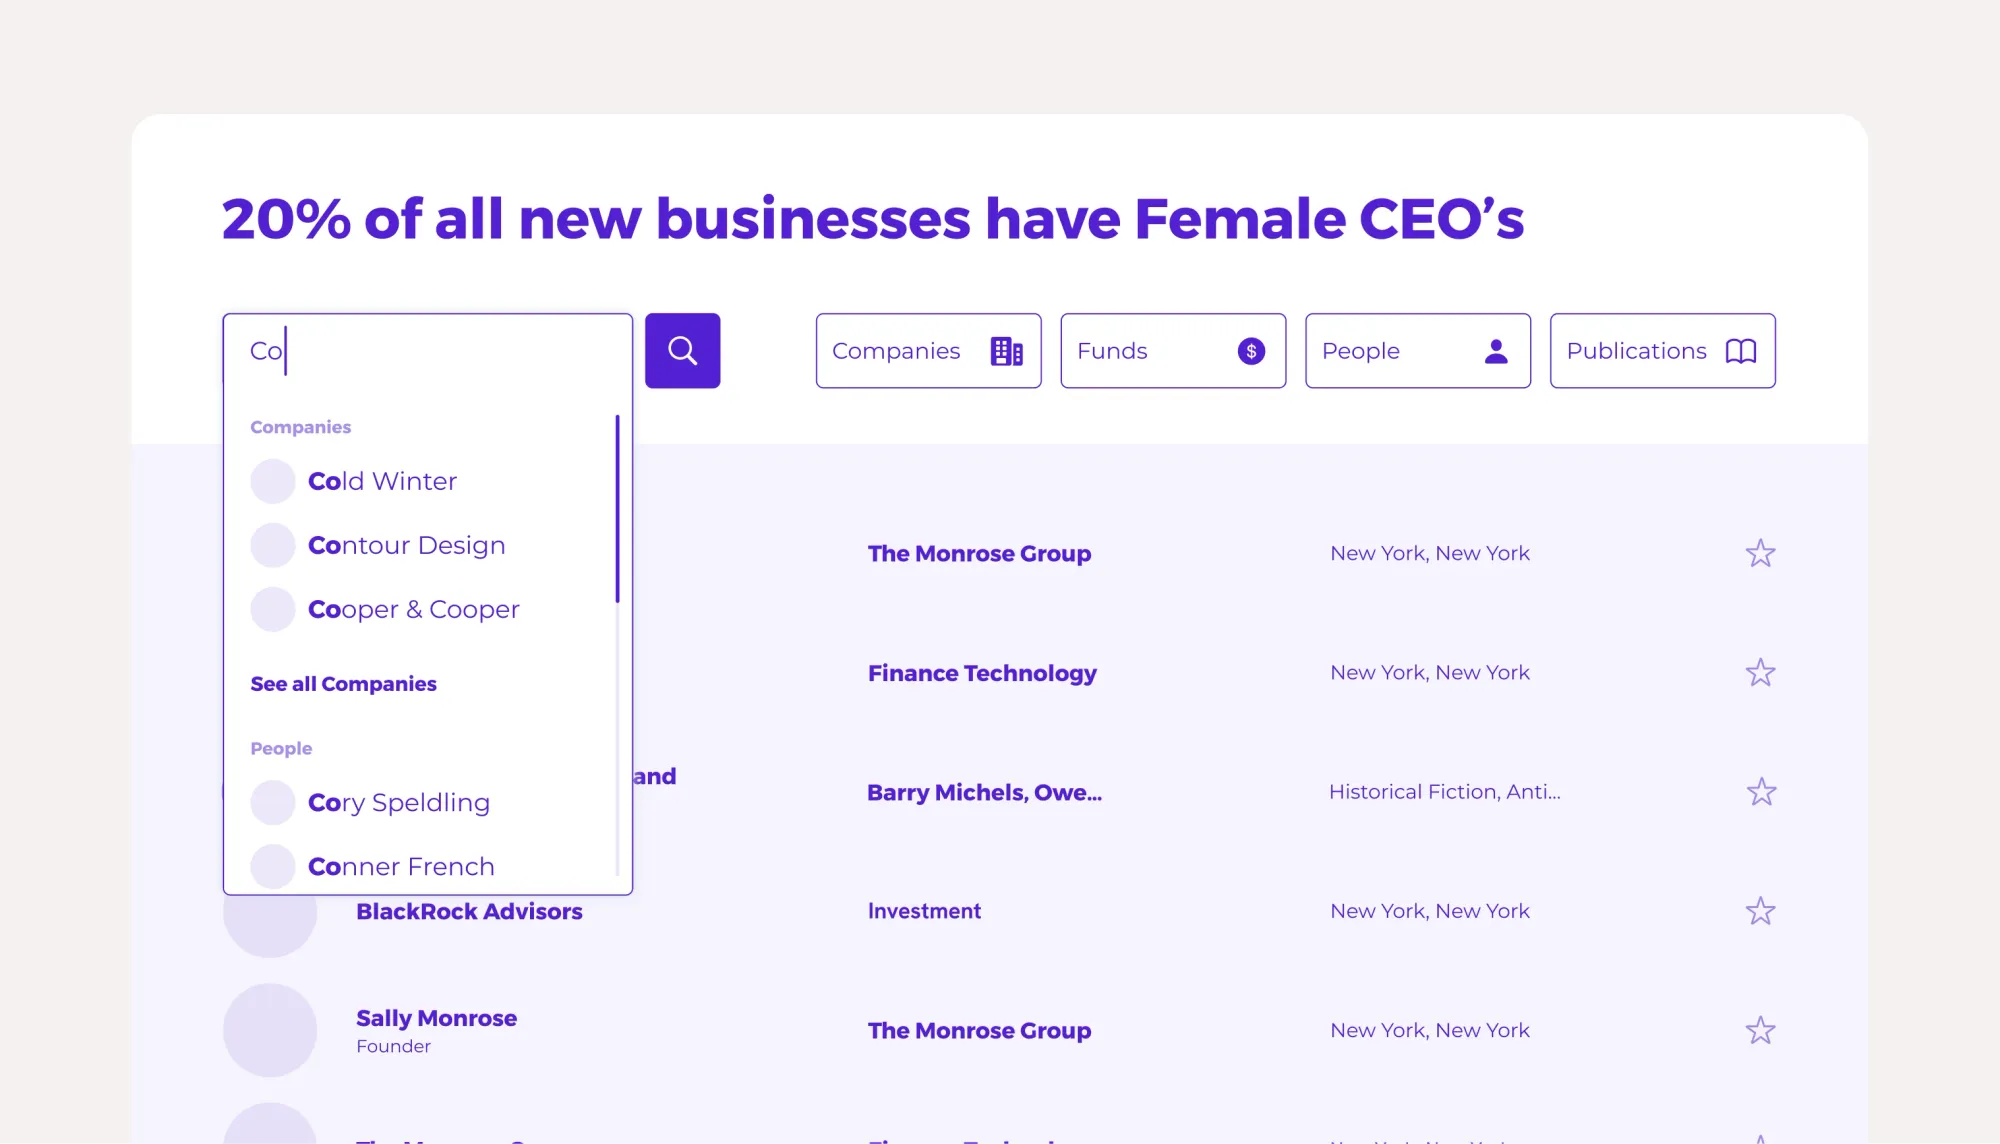
Display quantity indicators on your results lists.
Products can sometimes forget that part of what someone might want to know when viewing a set of results is the quantity of results inside a given data segment, filter or list. If I’m viewing a record of ‘Companies’ and filter that list to a location of ‘New York’ – it’s helpful for me to know that there were 10,156 companies in the list, and now there are 386, for example. This can be just as important in commerce products and many other products that support search queries.
Your lists can display simple text like:
Viewing 1-50 of 10,156 results.
And can grow to include more contextual updates when interacting with filters like:
Viewing 51-100 of 386 (filtered) results.
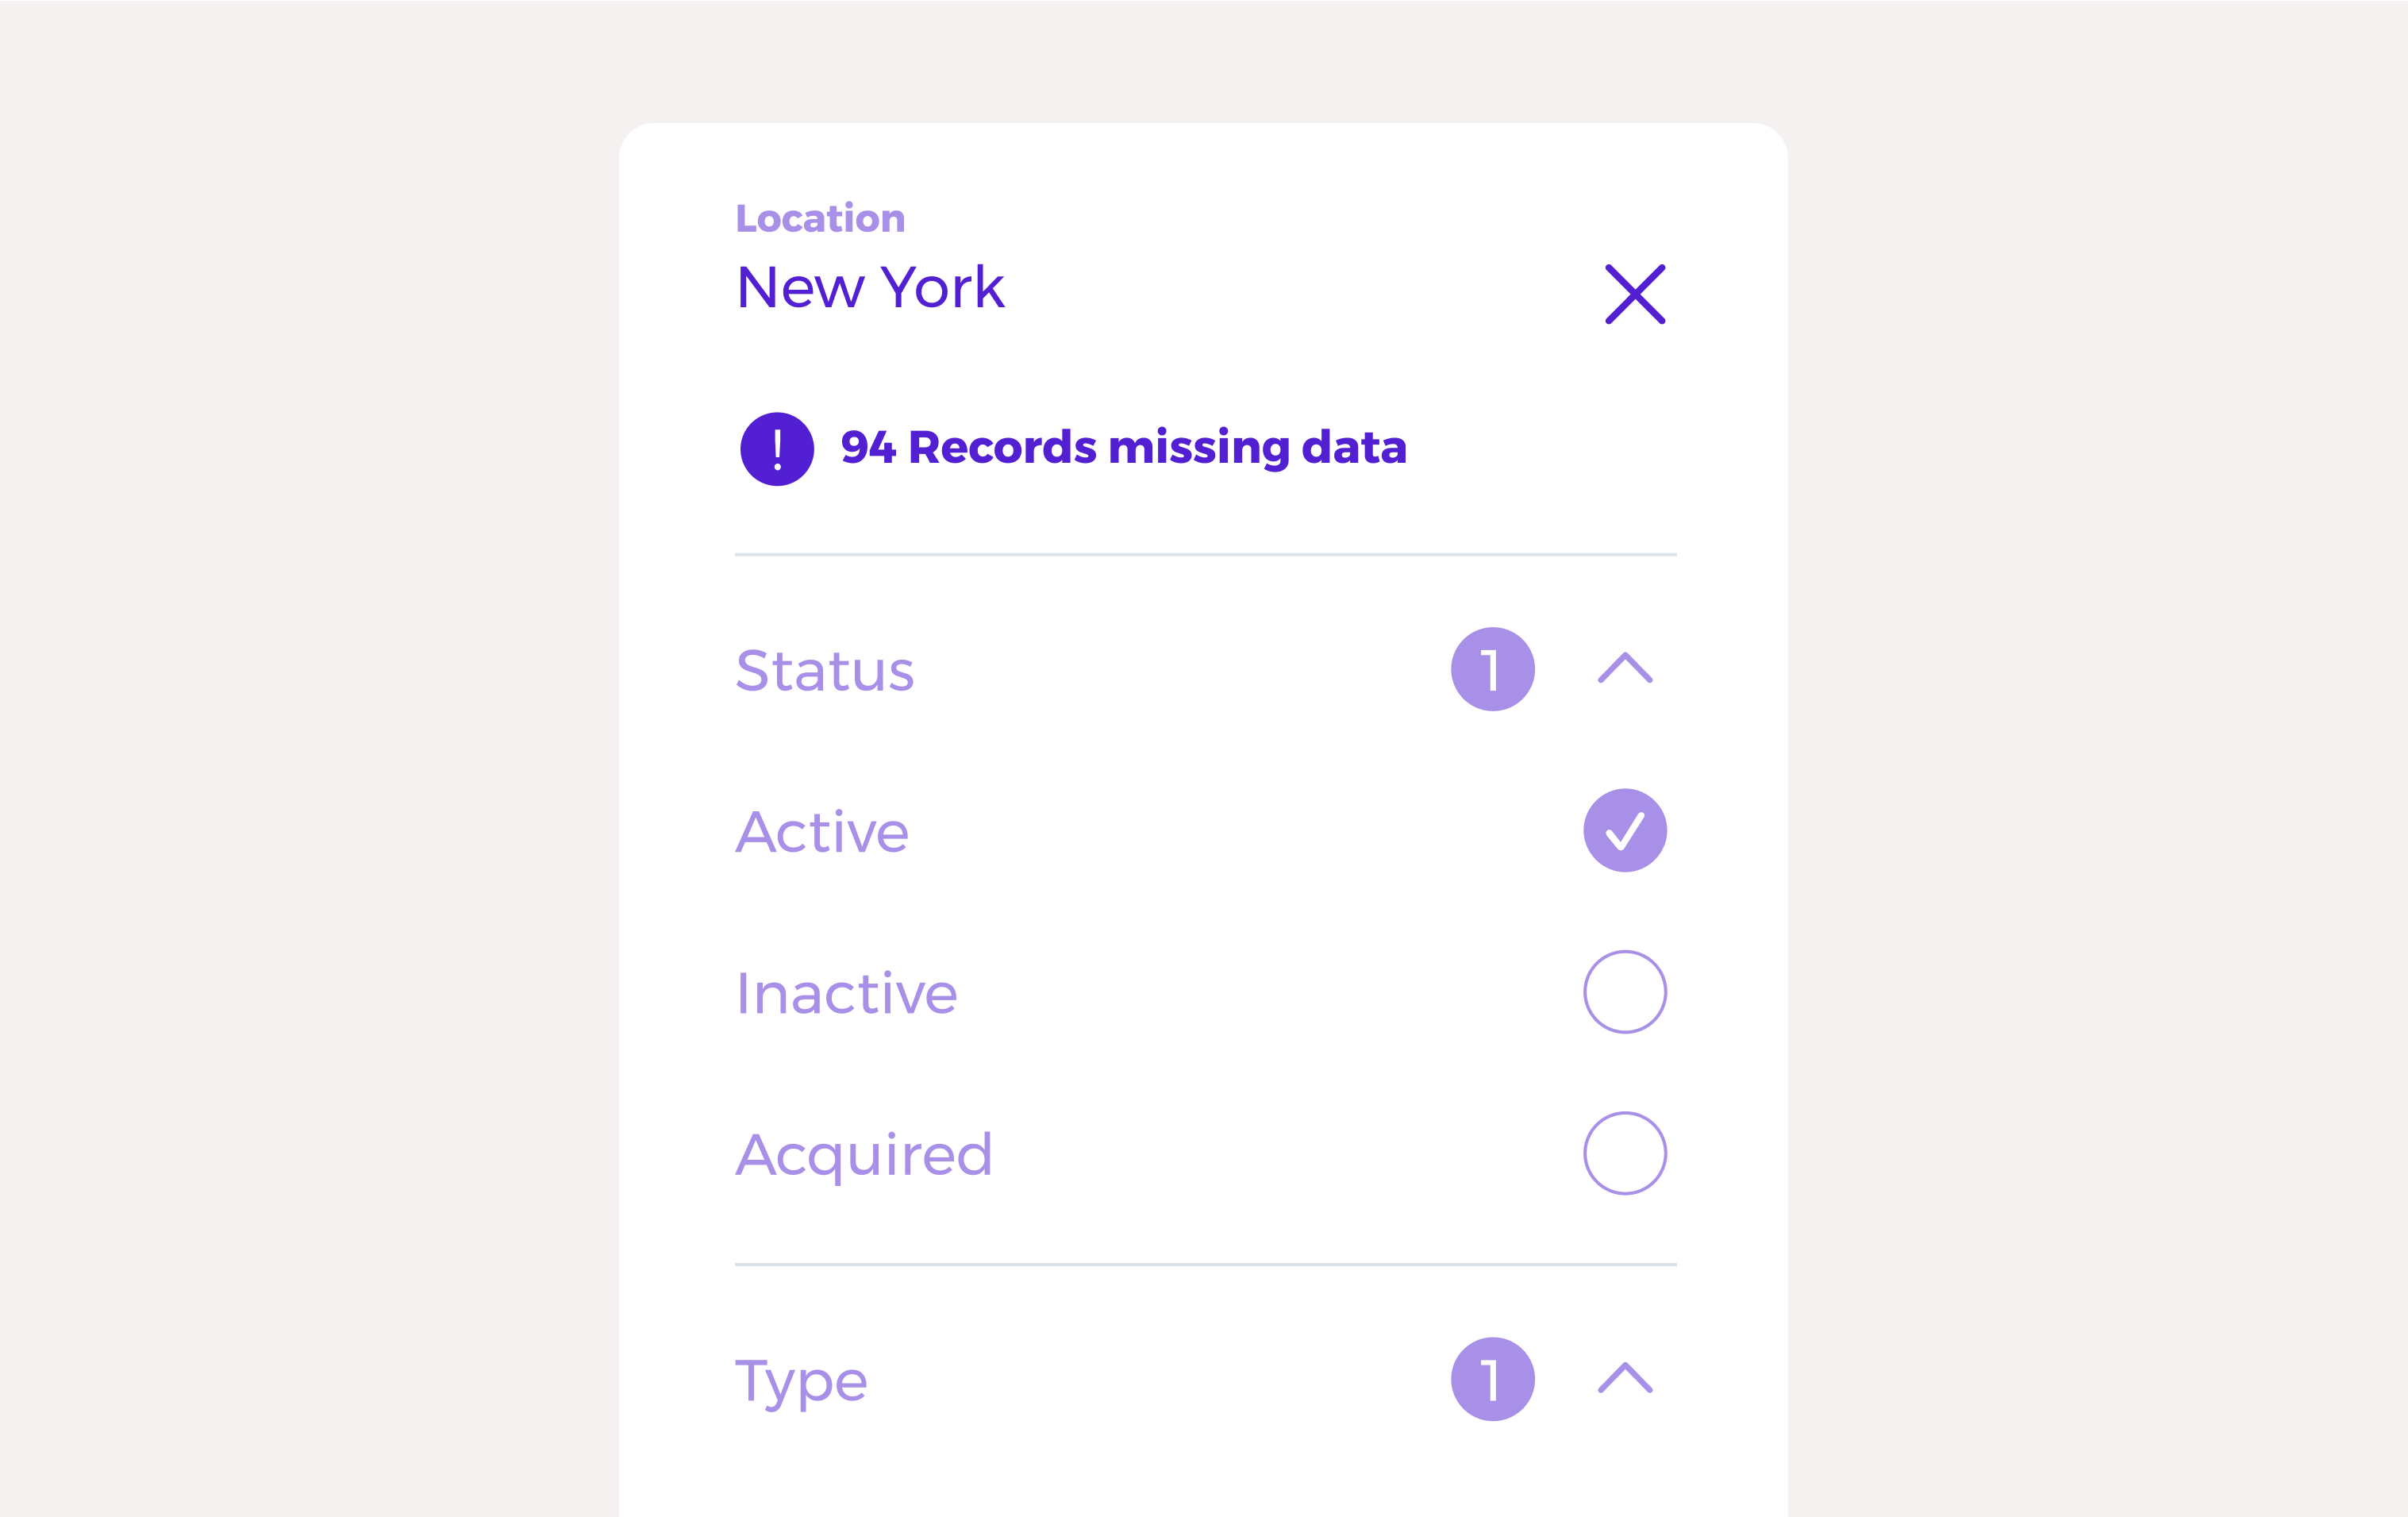
Establish clarity with the user on the comprehensiveness of the data (and decide how to approach your gaps).
If data inside your product is not complete – you must ask yourself the question, does the user expect it to be complete? Using our example above, if I’m viewing a product that displays a list of ‘Companies’ – what is the user’s expectation for completeness? Are they expecting you to have all companies in the product? Or only some? You should get ahead of these expectations.
Moreover, you should especially get ahead of these expectations regarding incomplete data inside a record. If I am viewing the aforementioned list of 10,156 companies and filter once again to ‘New York’ – but only a total of 800 companies actually have location data, it significantly changes my understanding of the results when I’m viewing them. Products often overlook this when records have missing data. If you’re going to provide functionality that interacts with incomplete data, you may want to support that with UI markers or copy on data headers on hover like:
Location (9356 records missing data)
Situations may make sense for you to approach your data gaps differently. Perhaps users can submit or update data, your product contains mostly partial data, you’ve added a new data field that is currently fully blank, or so on.
Display last updated dates on data entities.
When viewing records of data that exist within the product, especially those that have been synced from APIs or external sources or user updates – the product should display clear indicators to the user that highlight the last updated date of that record. This helps the user make sound judgment about how they use the data given its frequency of update and recency.
More advanced products might also consider displaying the method of update, or an actual full log of updates that can be expanded and viewed. Simple iterations might just be text on a record’s page like:
Last updated at: 2023.07.12

Decide if and how to approach user submitted data requests.
The larger the data catalog, and the greater number of sources – the more likely that you will need a mechanism for receiving and taking action on user submitted data requests. This may occur because you synced incorrect data, human error on manual data entry, or in large datasets the data may have actually just changed. ‘Companies’ as we listed above, may submit their own updates as to personnel changes quicker than your data ingestion process, and so on, assuming that your product (if popular) may be displaying information that is sourced and referenced by key constituents like investors.
If your product does not support a detailed method of users interacting or updated individual data fields, you should include a simple form submission email trigger on record pages with copy like:
Something incorrect or needs updating with this data? Contact us.

Consider all possible and convenient navigable elements for sorting and filtering.
In many data table displays user experience is harmed by not taking a critical look at the outset of page design with a clear plan of action on what data in the table is sortable on a column-by-column basis. Pages are affected by:
- Top-level navigation (Am I looking at the ‘Companies’ table, or the ‘Investors’ table)
- Default sort
- How many data columns are there and which are sortable
- Are sortable data columns combinatorial (can I use more than one at a time)
- How this all interacts with filters
Establishing all the states of interaction across table sorting, filtering, column/data-point sorting will ensure that you have a clear understanding of how your tables need to be manipulated, but also just what questions someone can answer simply by using your data tables as they are presented.
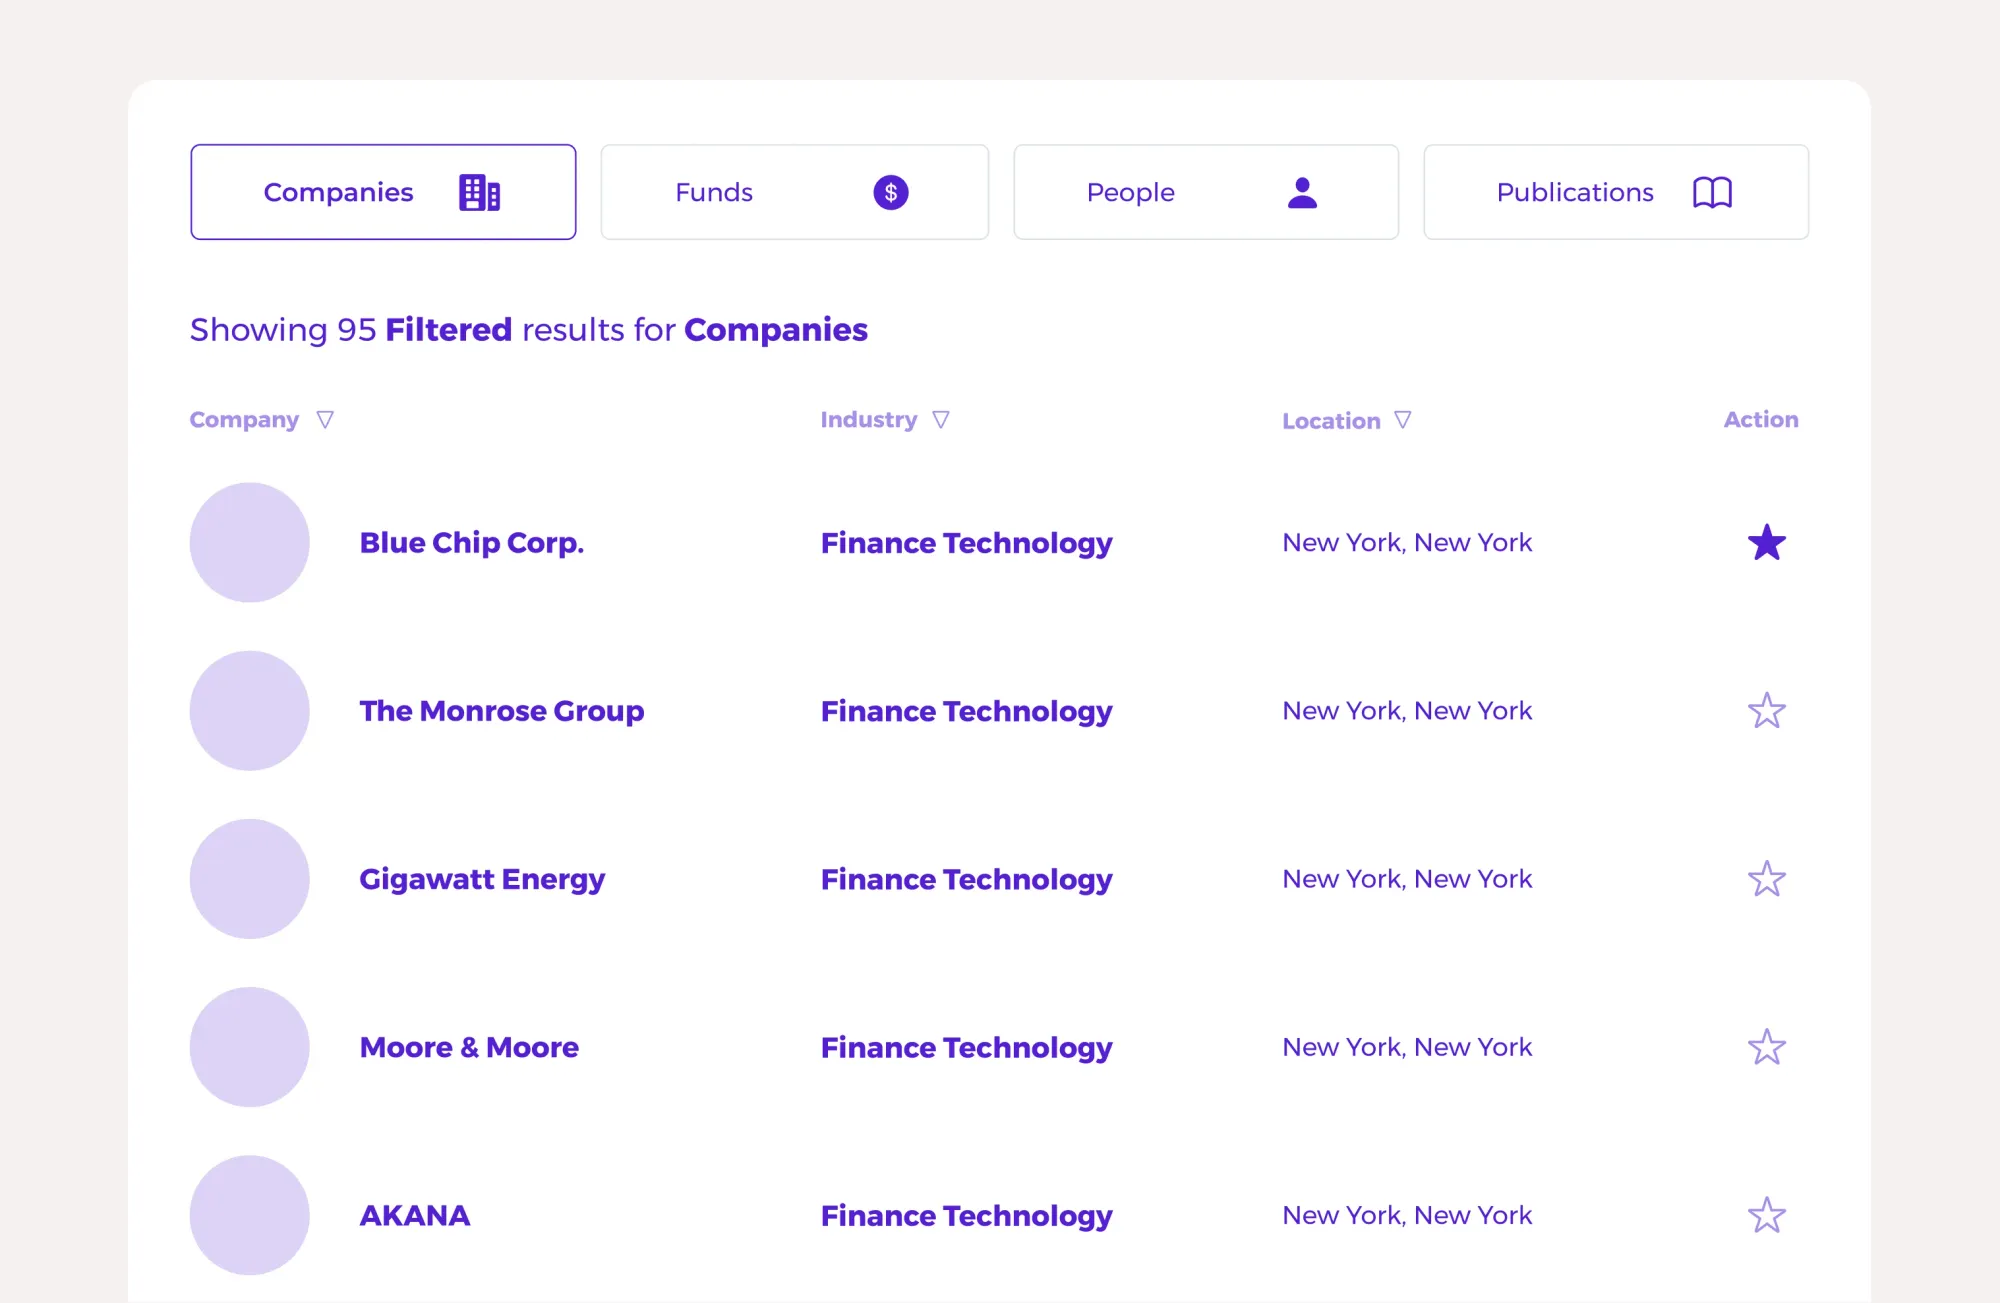
Display data table and field level titles.
In complex data table interfaces with many columns and rows, it should go without saying that the driving desire to keep a table clean in modern design might encourage you to get right into the results – however, to support the user it’s much more important to retain things like data column headers and field title markers. Floating the records without these simple headers removes locations where user expectation exists around interacting with table column sorting and more.
As users navigate your product (and especially as the might navigate your product with tighter displays on mobile), you’ll find that maintaining these things makes navigation faster, understanding what they are seeing more likely to occur and later, maturing in to using pinned and frozen data headers may make a strong data table display even stronger.
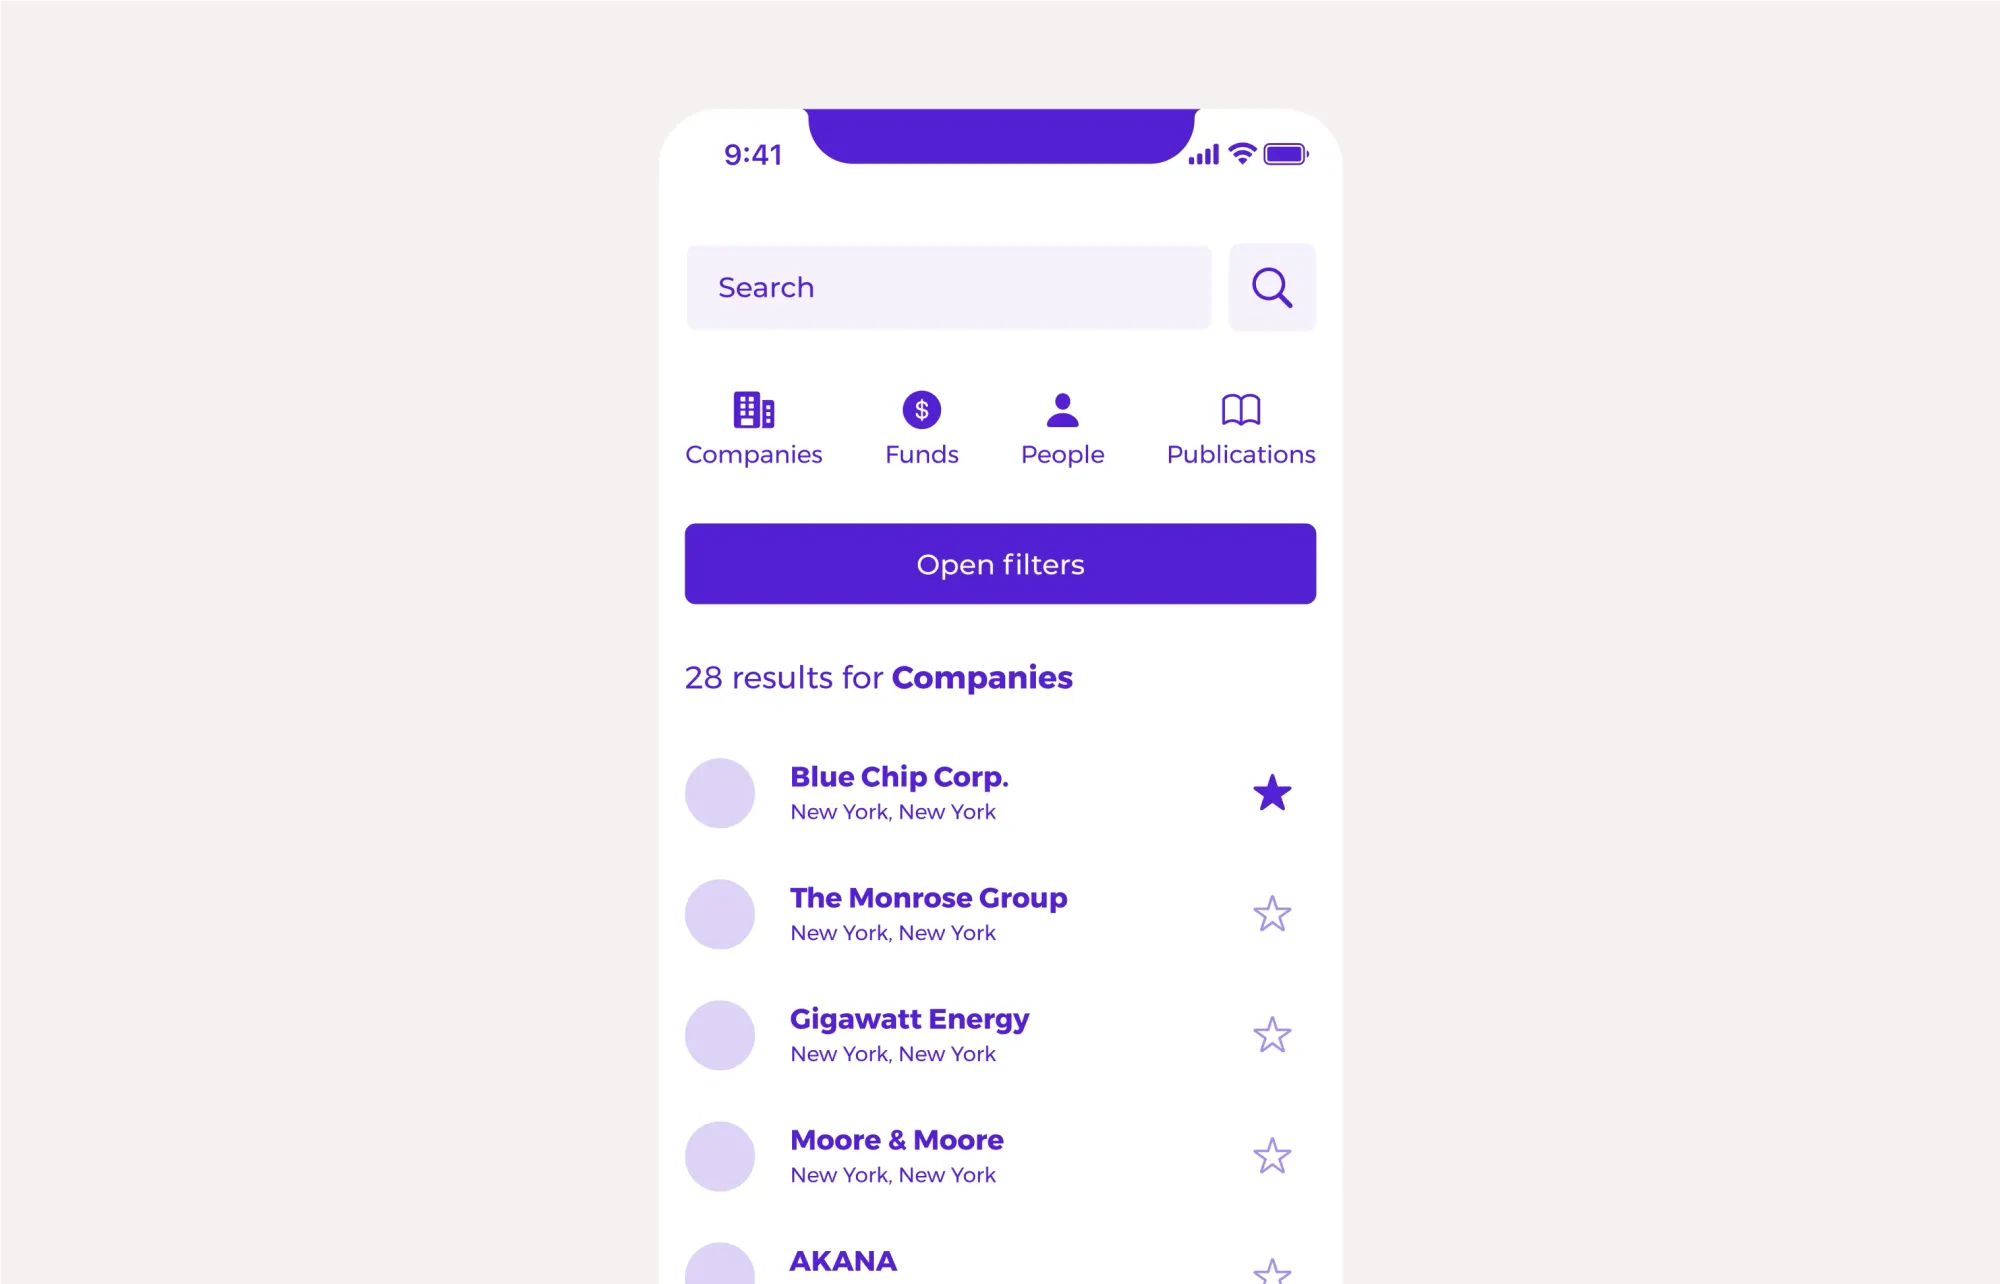
Do not remove search from any view.
This advice need to be considered against the type of data product you’re building and the user behavior – but in nearly all products, from commerce to social to marketplaces and data-heavy research, a key path in usage is simply for a user to click in to a search field and attempt to find the record they’re looking for. The more complex your data, the more complex your results might need to be, but the baseline interaction is the same. Users want to and will look to search a record from your landing page, from your table displays, from an individual record page.
To that end, never remove search or change the primary search location. You should support the user's need to reattempt search, change their query pattern or restart with a new search after landing on a result. Never force a user’s search query into a specific type now that they’re viewing a specific result type, either.
If a user has searched for the ‘Company’ ‘Acme Corp.’ clicked on, and is now viewing ‘Acme Corp.’s page, they should be able to use the same search interface to now search for ‘Steve Jobs’ – a different type of record, using the same interface for search. If you’re not prepared to develop a multi-faceted search typeahead, then it is actually better to allow the user to use the same search interface, and take them to a results page, than ask them to ‘go find the other place you can search from’.
Decide if data depth should allow for showing and hiding columns.
The larger the data for a given data record type, the more you have to decide what data is important enough to display on data tables and what should be reserved for the full pages for each record. In the beginning, the simple breakdown might be a small set of key data, especially highlighting data that a user might expect to sort columns by. For ‘Companies’, this might be:
- Company Name
- Size
- Industry
- Location
- Company Type
However, as your data grows and you establish more and more field types, you may discover that your key data has grown to include:
- Total Funding Amount
- Last Funding Round
- Number of Investors
- Year Founded
- Subtype
- Status
- …and more
As your data grows, you not only need to address what data order and defaults should be on your data tables, but you may need to explicitly allow users to show and hide data columns on your table displays. Either adding data that isn’t shown by default but is among your dataset, or removing unnecessary data so they can more simply see what they are attempting to inside your tables.
If necessary, controls where users can bring up a full data fields list for a record like ‘Company’ and then toggle on or off data might be the difference between users finding your product is perfect for their use case, or frustrating.
We’ve only just cracked the ice on data tables.
Data tables and data heavy products may seem simple, in one way, as they’re at the heart of databases and every spreadsheet export we’ve ever used. But, when you come to interpreting how that functionality evolves into the user experience of a capable web application, you need to look beyond the table itself and at the many considerations we’ve started to list here. And there are no doubt many more to come. Data tables on mobile devices, supporting exports and large scale imports, and more. We’ll no doubt prepare another entry in the Building Better Products series on data tables, or you can view other product types as well, but if you’re looking to create a data intensive product, you can always contact Studio now and we’ll help you answer all of these questions and more.